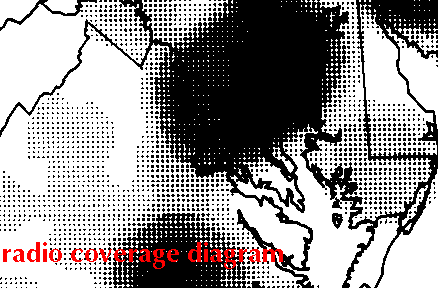
radio-coverage diagram
A diagram that shows the area within which a radio station is broadcasting an effective signal strength in relation to a given standard.
Note: An example of a radio-coverage diagram is a polar plot, in each direction from the antenna, of the distance from the antenna at which the signal strength is equal to a specified value, i.e., it is the locus of all points at which the signal strength is equal to a specified value. [From Weik ’89]